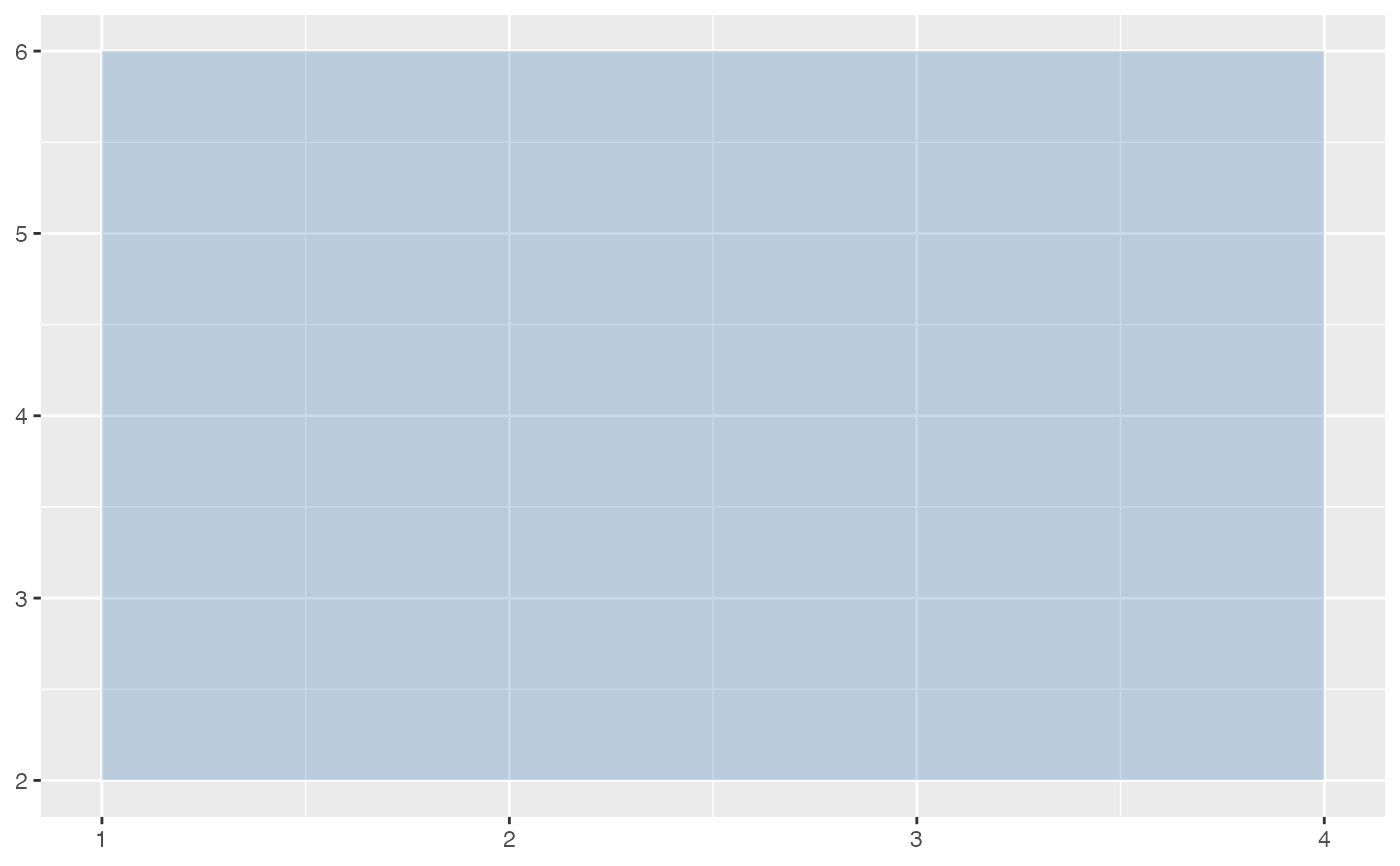
Converts a table of lower and upper x/y boundaries into rectangular
ggplot2 layers.
Arguments
- rule_tbl
A data frame containing
x,y, andboundcolumns. Theboundcolumn should contain"lower"and"upper"values.- ...
Additional arguments passed to
ggplot2::geom_rect().
Value
A list containing a ggplot2::geom_rect() layer.