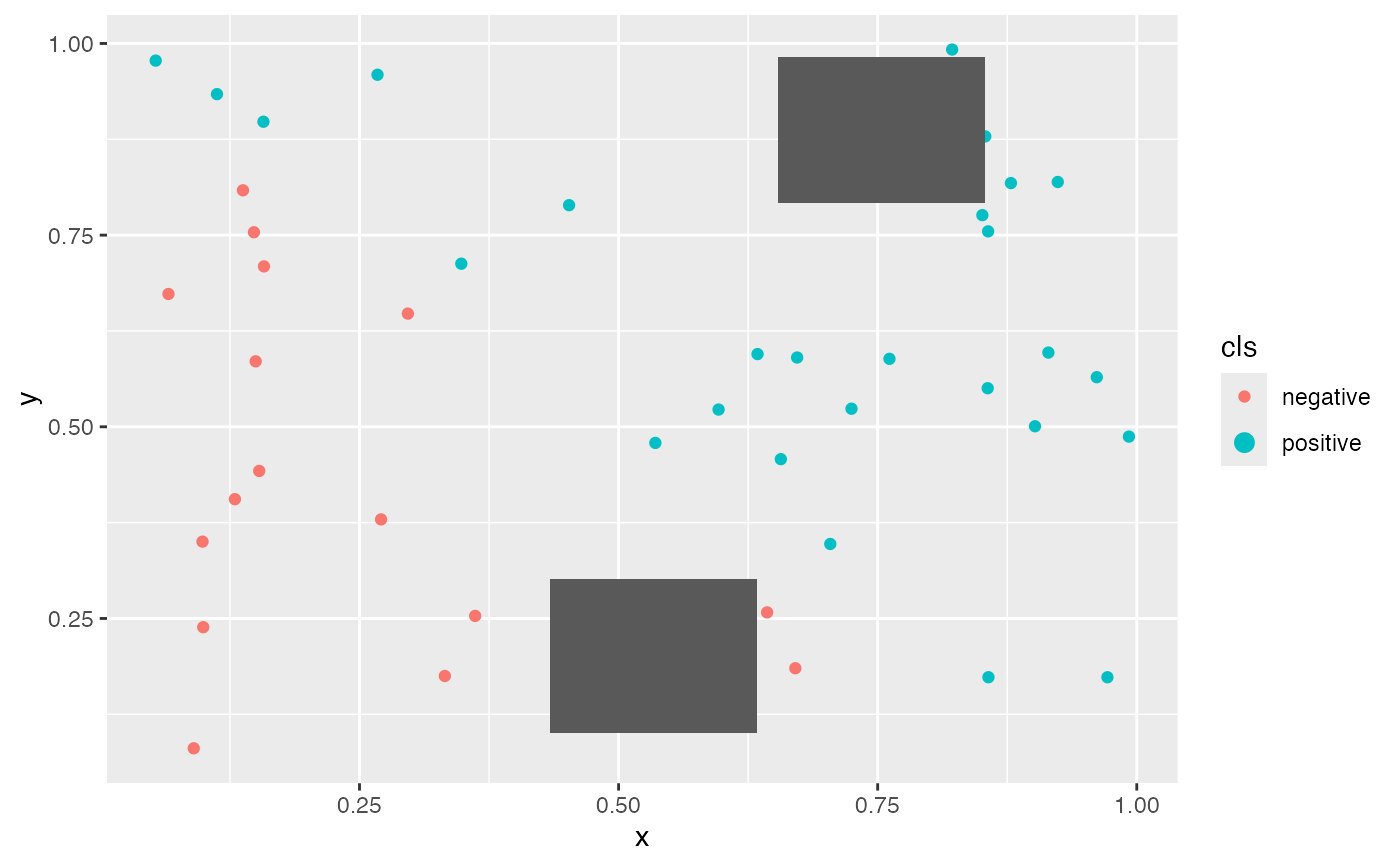
Visualize the anchor in two dimensional space
Arguments
- anchors
The result of
make_anchors()function call.- dataset
The dataset passed to
make_anchors()- instance
The point of interest
Examples
set.seed(145)

dataset <- data.frame(
  x = runif(50),
  y = runif(50)
)

dataset$cls <- ifelse(
  dataset$x + dataset$y > 1,
  "positive",
  "negative"
)

# A simple model function.
model_func <- function(data) {
  ifelse(data$x + data$y > 1, "positive", "negative")
}

# Generate anchors for two observations.
instance <- c(1, 2)

result <- make_anchors(
  dataset = dataset,
  cols = c("x", "y"),
  instance = dataset[instance, c("x", "y")],
  model_func = model_func,
  class_col = "cls",
  n_bins = 2,
  seed = 145
)
#> INFO [2026-08-28 17:10:21] setting up bin edges
#> INFO [2026-08-28 17:10:21] setting lower bounds
#> INFO [2026-08-28 17:10:21] Have 1 lower bounds with 0.653931205254048
#> INFO [2026-08-28 17:10:21] setting upper bounds
#> INFO [2026-08-28 17:10:21] Have 1 upper bounds with 0.853931205254048
#> INFO [2026-08-28 17:10:21] setting lower bounds
#> INFO [2026-08-28 17:10:21] Have 2 lower bounds with 0.887393567832187
#> INFO [2026-08-28 17:10:21] Have 2 lower bounds with 0.792393567832187
#> INFO [2026-08-28 17:10:21] setting upper bounds
#> INFO [2026-08-28 17:10:21] Have 1 upper bounds with 0.982393567832187
#> INFO [2026-08-28 17:10:21] received precisions 1 , NA
#> INFO [2026-08-28 17:10:21] found new max_reward -1 and node 1:1:1:1
#> INFO [2026-08-28 17:10:21] max_values
#> INFO [2026-08-28 17:10:21] 1:1:2:1
#> INFO [2026-08-28 17:10:21] received precisions 1 , NA
#> INFO [2026-08-28 17:10:21] max_values
#> INFO [2026-08-28 17:10:21] 1:1:2:1
#> INFO [2026-08-28 17:10:21] setting lower bounds
#> INFO [2026-08-28 17:10:21] Have 1 lower bounds with 0.434021162660792
#> INFO [2026-08-28 17:10:21] setting upper bounds
#> INFO [2026-08-28 17:10:21] Have 1 upper bounds with 0.634021162660792
#> INFO [2026-08-28 17:10:21] setting lower bounds
#> INFO [2026-08-28 17:10:21] Have 1 lower bounds with 0.101150634791702
#> INFO [2026-08-28 17:10:21] setting upper bounds
#> INFO [2026-08-28 17:10:21] Have 1 upper bounds with 0.301150634791702
#> INFO [2026-08-28 17:10:21] received precisions 1 , NA
#> INFO [2026-08-28 17:10:21] found new max_reward -1 and node 1:1:1:1
#> INFO [2026-08-28 17:10:21] max_values
#> INFO [2026-08-28 17:10:21] 1:1:1:1

# Visualise the resulting anchors.
plots <- vis_anchor(
  anchors = list(result),
  dataset = dataset,
  instance = 1
)

plots[[1]]